An autonomous vehicle testing facility required actual driving data in large scale from Insurance companies, Automotive research wings, car manufacturers and the like. The collected data needs to be stored and analysed on a cloud-database to be represented in a visually intuitive dashboard.
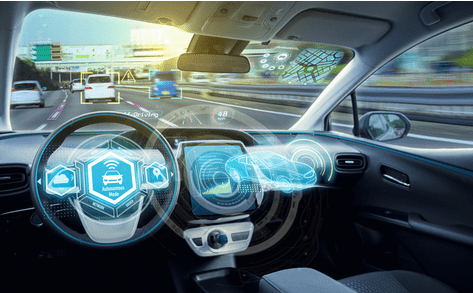
Alumnus built a suite of data visualization platforms to display different types of vehicle operation data in a single window. Several other real time data was also displayed synchronised with the videos. They included raw CAN data, vehicle location, steering angle, speed and direction.
This data is then processed and made available for analysis and reporting. The entire output is used to improve the performance of autonomous vehicles.
The platform displayed video recordings of the road ahead, side-by-side with a close-up video of the driver’s face, from in-car cameras. The videos were tagged with real-time object detection, and emotional and facial cues of the driver, as output by specialized software.
Technology Stack:
Node.js, MongoDB, Bootstrap, JQuery, Canvas.js, Google Map API v3.0, Darknet, YOLO, Affectiva, Ffmpeg